Generating a quarterly sales report from a MySQL DB Using Smart Pivot Table
In this tutorial, we will show you how to create a simple quarterly sales pivot table from MYSQL DB using Smart Pivot table in just a few mouse clicks!
Pivot Tables are a powerful tool that’s used by data analysts to see comparisons, patterns, and trends in their data.
In this tutorial we will show you how to instantly generate a simple pivot table from multiple MySQL related tables.
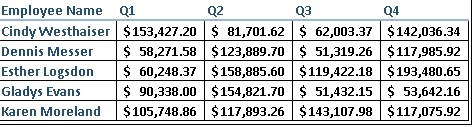
The report, we are trying to generate in this tutorial, should include the sales per quarter for each employee , as in the example shown in the following image:
Let’s assume we have a database for storing sales data of a company In a real life scenario, many tables and columns will be included. But in this tutorial, we will focus only in two tables which are :
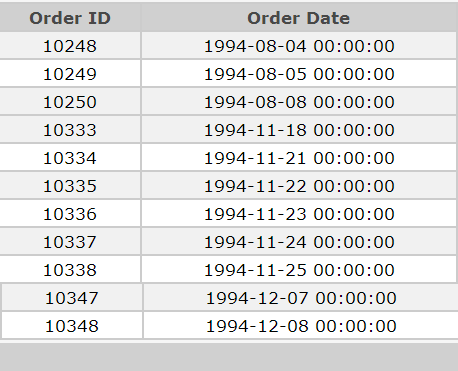
1) The “Orders” table from which we need to focus only on two columns:
- Order ID
- Order Date
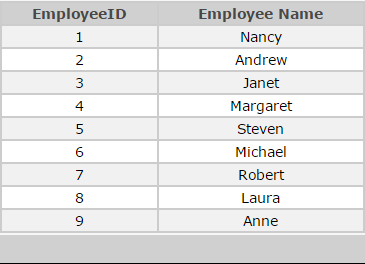
2) The “Employees” table from which we need to focus only on two columns
- Employee ID
- Employee Name
Building this report using Smart Pivot table couldn’t be easier!! The first step is to connect to your MySQL database.
Then once a connection is established you will define the settings of the pivot table
First the General settings:
The title: we should add “Quarterly Sales Report”
Smart Pivot table gives you the ability to password protect your tables so only the software administrator can view it. This is recommended if your table includes confidential information. In this example, we will enable password protection.
Now we will need to specify the column labels to define what exactly will be listed as the headers of the report. In our example, we want to display the quarters as the header. So, we will select the “Orders” table and the “Order Date” field.
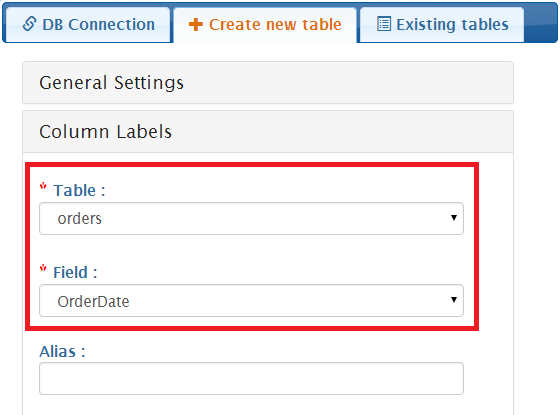
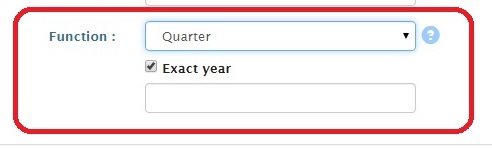
The moment we select the “order Date”, a new box should appear, in this box we will choose “Quarter” because we want to display the “sales per quarter”.
In a similar manner as we created our columns, we will display “Employees” in the “Row labels” area. We will select the “Employees” table and the “Employee Name” column .
Values should be listed in the main body of the generated table. In this example, we want to display the total number of orders, so we will select the “Orders” table, the “OrderID” field and the “Count” function.
Finally the relationship step. in our tutorial the join field between the “Orders” table and the “Employees” table is the “Employee ID ” column.
Click generate, That’s all there is to it!