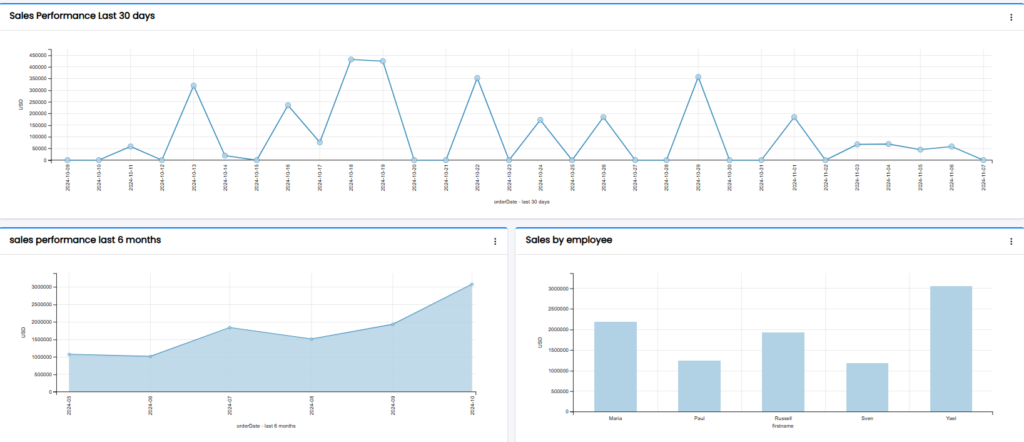
Smart Report Maker simplifies PHP charts and data analysis for MYSQL by enabling users to create various types of PHP charts filled directly from their MYSQL databases. These charts help in visualizing data effectively, with features such as drill-down capabilities and detailed reports. PHP Charts are displayed as widgets on the chart management page and can also be used as dashboard components, offering flexible ways to present data insights.

Public and Private Charts
Similar to reports, Smart Report Maker supports both public and private charts:
- Public Charts:
- These charts can be shared with anyone, even without requiring login.
- They can also be embedded in web pages, where users can interact with the chart, drill down into specific sections, export it to PDF, or print it.
- Private Charts:
- Only admins and users belonging to groups with specific permissions can access these charts.
- Private charts also support drill-down features and detailed reports.
Creating and Managing PHP Charts
- Creating New Charts:
- Charts can be created by admins or users whose groups have permission to create new charts.
- Navigate to the “Charts” section from the left panel to access the chart management page. If you have the required permissions, you will see the “Add New Chart” button. Otherwise, you can only view charts accessible to your group.
- Chart Widgets:
- On the chart management page, charts are displayed as widgets. Widgets can have either half-page or full-page width, based on how the creator configures them during chart creation.
- On the chart management page, charts are displayed as widgets. Widgets can have either half-page or full-page width, based on how the creator configures them during chart creation.
- Editing or Deleting Charts:
- Charts can be edited or deleted by either the admin or the user who created the chart (if the user has a regular role).
Drill-Down Charts and Detailed Charts for Deeper Analysis
Drill-down functionality allows users to interactively explore deeper layers of data by clicking on specific sections of the chart (e.g., clicking on a bar to see the breakdown of sales by product category). This feature is critical for effective data analysis because:
- It provides detailed insights beyond the surface-level chart.
- Helps decision-makers identify trends, patterns, and anomalies quickly.
- Enables users to explore the underlying data
- Enabling the Drill-Down Feature :
- A chart creator can enable the drill-down feature, which allows users to click on specific sections or bars to access a detailed report related to that section.
- Use Case Example: If you have a pie chart showing sales by country, clicking on a country section will display a report with detailed sales data for that country.
- Inside the drill-down view, users can print or export the report to PDF for further analysis.

- A Summery Report:
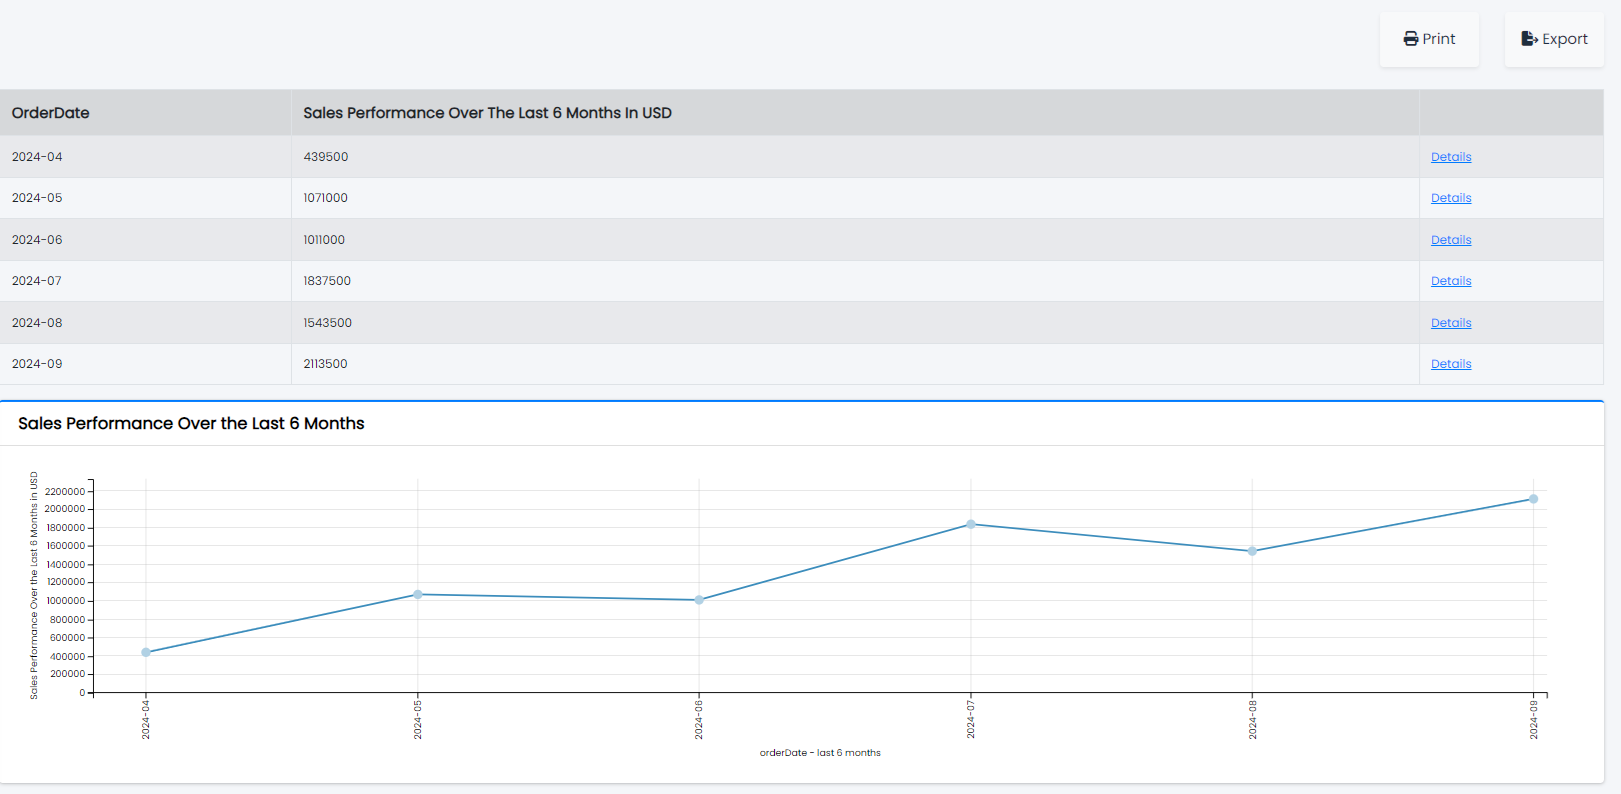
- A Summery Report includes both the data used to generate the chart and the chart itself within the same report. Additionally, You can choose to Export detailed chart view to pdf
- To access the Summery Report of any chart, click the three dots on the chart widget and select “Display”.

Supported Chart Types
Smart Report Maker supports a variety of PHP chart types to suit different data analysis needs:
- Bar Charts
- Horizontal Bar Charts
- Line Charts
- Timeseries Charts: Ideal for data with a time-based X-axis.
- Spline Charts
- Pie Charts
- Donut Charts
- Scatter Charts
- Area Charts
How to Share or Embed Charts
Follow the following steps to share or embed public charts created by Smart Report Maker
Steps to Retrieve the Public Chart URL
- Ensure Chart Access Level is Set to Public:
- When creating or editing the chart, set the Access Level to Public so that it can be accessed without login.
- When creating or editing the chart, set the Access Level to Public so that it can be accessed without login.
- Display the Chart:
- Go to the Charts Management page.
- Locate the desired chart and click the three dots on the widget to open the Actions menu.
- Select “Display” to view the detailed chart.
- Copy the URL from the Detailed Chart Page:
- On the detailed chart page, copy the URL from your browser’s address bar.
- The URL should follow the following format:
Your-domain/Path-to-srm/srm/dashboard/charts/details/{{chart_id}}
- Verify the URL in Incognito Mode:
- Open a new incognito window (or private browsing mode).
- Paste the copied URL and hit enter.
- If the chart is public, it should open without requiring login. If it does not open, verify that the chart’s access level is correctly set to public.
- Use the URL in Your Webpage or Embed It in an Iframe:
- Once verified, you can link to the chart from your webpage or embed it in an iframe.
Iframe Code Example:
To embed the chart in your webpage, use the following HTML iframe code:
<iframe src="{{chart_URL_Here}}" title="{{any_title_you_want}}" width="100%" height="600"></iframe>Conclusion
Smart Report Maker provides a robust platform for MySQL charts and data analysis, helping users create visualizations that offer valuable insights. With support for multiple chart types, interactive drill-down reports, and public or private sharing options, Smart Report Maker ensures that data can be explored efficiently and shared with the right audience.
