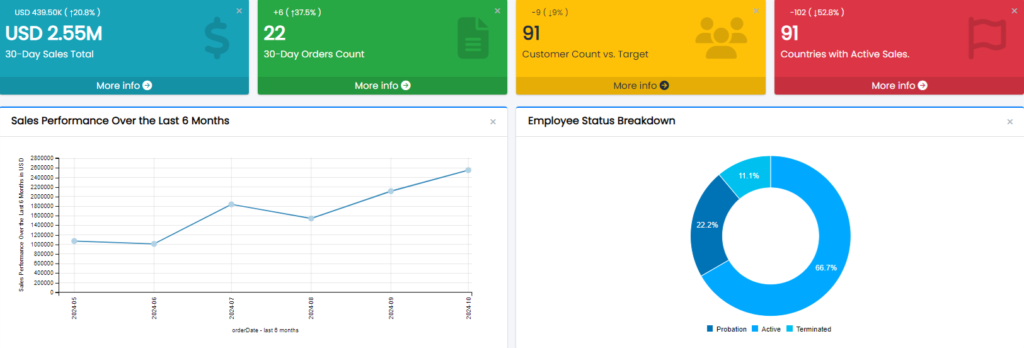
Dashboards play a central role in visualizing and tracking essential data from MySQL databases, empowering users to organize and interact with key performance indicators (KPIs), charts, and reports. In Smart Report Maker, each PHP dashboard is highly customizable, allowing users to tailor their data experience. This article will walk you through managing PHP dashboards, including setting up the Home Dashboard and creating additional dashboards for focused insights.
Home Dashboard: Your Centralized Data Hub
The Home Dashboard is your main dashboard and acts as the first page you see upon logging in. This dashboard is essential, as it typically contains high-priority widgets—KPI metrics, critical charts, and relevant reports—that provide an at-a-glance overview of your data.
Each user can fully customize their Home Dashboard, choosing the widgets that best reflect their needs and preferences. The customization options make it a personalized data hub, with widgets tailored to the user’s role and focus.
Customizing Your Home Dashboard
To add widgets to your Home Dashboard:
- Click the “Add Widget” Button: This button lets you start adding resources.
- Select Resource Type: Choose from:
- Charts: Displays all charts the user has access to in a dropdown menu. Admins can access all charts, while regular users see charts available to their group.
- KPIs: Works similarly to charts, allowing users to add KPI widgets.
- Report List: Adds a list of report links, each opening its respective report. The report list also requires a name to label the group of reports.
Once you’ve added charts and KPIs as widgets, you can interact with them just as you would on their original pages. Drill-down and summary reports are fully functional, allowing users to explore data interactively, diving deeper into metrics and obtaining detailed insights. This interactivity is a powerful feature, enabling users to:
- Analyze Data Trends: Drill down into specific data points, like sales by region or employee performance by department.
- Track KPIs in Real Time: Follow up on KPIs with live data, helping you make decisions based on the latest metrics.
Dashboard Management: Organizing Additional PHP Dashboards
Besides the Home Dashboard, users can create and manage additional dashboards to organize specific sets of data from their MySQL database.
- Accessing Dashboard Manager:
- Click “Dashboards” from the side panel, then select Dashboard Manager.
- This page shows all existing dashboards, allowing users to view, create, and manage them.
- Quick Access to Dashboards:
- The first five dashboards you create are listed under “Dashboards” in the side panel, making them easily accessible. All other dashboards can be accessed from Dashboard Manager.
- Managing Dashboard Order:
- For quick access to key dashboards, use the Move Up or Move Down options in Dashboard Manager to reorder dashboards. This is especially useful since only the top five appear in the side panel, allowing you to prioritize the most important dashboards for immediate access.
- Display Options for Each Dashboard:
- Display: Opens the dashboard to view its widgets and interact with the data.
- Move Up/Down: Adjusts the dashboard’s position, impacting its display order in the side panel.
Adding and Editing Dashboards
Adding a new dashboard is simple and can be done from the Dashboard Manager or the Quick Add button in the top-right toolbar.
- Adding a Dashboard:
- Click Add Dashboard in Dashboard Manager, or use the Quick Add icon.
- This opens the Add/Edit Dashboard popup where you set up basic information.
- Editing Dashboard Information:
- Name: This name appears in the side panel and Dashboard Manager.
- Icon: Choose a Font Awesome (FA) icon to represent the dashboard in the side panel and Dashboard Manager.
- Title: The title appears directly on the dashboard page, giving context to its contents.
- Customizing with Widgets:
- Once you’ve created or opened a dashboard, you can customize it by clicking Add Widget.
- As with the Home Dashboard, select a Resource Type (chart, report, or KPI) and then choose the specific resource from your available options.
Practical Use Cases for MySQL Dashboards
PHP dashboard in Smart Report Maker offer flexible options for tracking key metrics, visualizing trends, and interacting with data. Some common scenarios include:
- Sales Performance Tracking: Use KPIs and charts to monitor monthly sales, track growth, and compare performance over time.
- Employee Performance: Create dashboards with KPIs like average tenure or productivity metrics, and use conditional filters to focus on specific departments.
- Operational Efficiency: Set up a dashboard to track metrics like order processing times or customer support response rates, helping managers identify areas for improvement.
Conclusion
Smart Report Maker’s dashboard tools allow users to create personalized views, make data-driven decisions, and stay on top of performance trends. Whether you’re using the Home Dashboard for general insights or adding specific dashboards for targeted data analysis, these MySQL dashboards offer a powerful way to engage with and understand your data.

