In this tutorial, we’ll create a specific KPI that tracks sales performance over the last 30 days, comparing it with the preceding 30 days, tailored for MySQL data analysis. This will be set up as an Info Box KPI in Smart Report Maker, using the “Test_salesOrders” table and “OrderID” column from the default connection. Let’s explore each step, the choices we make, and how additional filters can enhance this KPI for targeted MySQL data analysis.
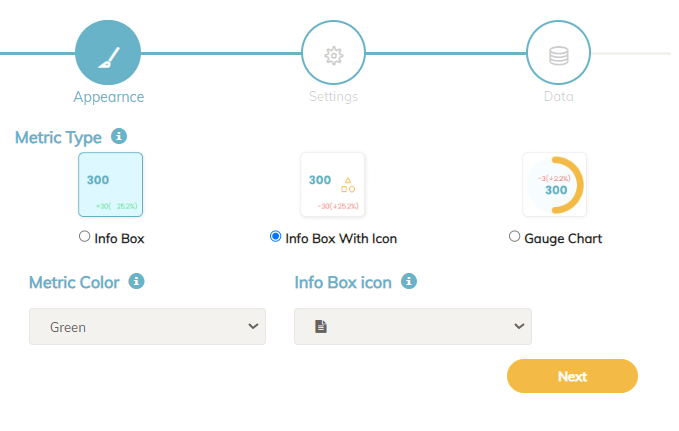
Step 1: Setting Up the Appearance
- Select Display Format: Choose Info Box for a simple numeric display, making it easy to track the order count at a glance. We’ll set the Info Box color to Green for visual impact.
- Choose Other Display Options (Optional): If needed, you can also select Info Box with Icon for added context.
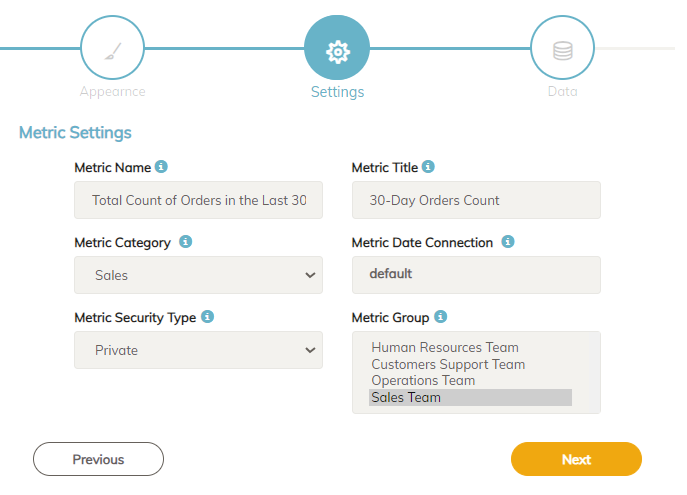
Step 2: KPI Settings
- KPI Name and Title:
- Set the KPI Name as “Total count of orders in the last 30 days”.
- Use KPI Title as “30-Days Order Count” to provide context to users viewing this metric.
- Category:
- Assign the KPI to a Category like “Sales” to help with organization and filtering.
- Data Connection:
- Select the default connection, which includes the Test_salesOrders table.
- Security Type:
- Choose between Public or Private. For internal tracking, you may want to set it to Private and specify which user groups can access the KPI. Public KPIs, even with users who are not logged in.
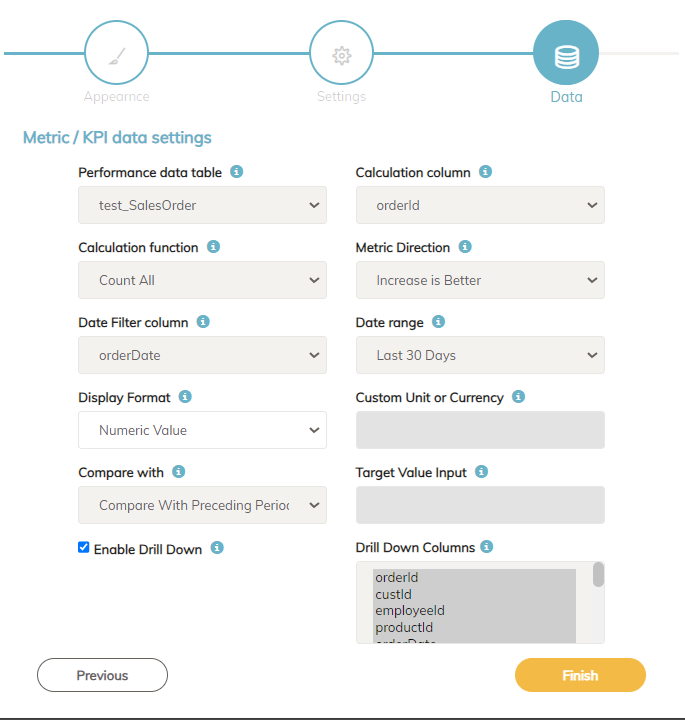
Step 3: Data Configuration
In this step, we set up the data sources and calculations for the KPI.
- Performance Table:
- Select Test_salesOrders as the table containing the order data.
- Calculation Column:
- Use OrderID as the calculation column to count each order as one entry.
- Calculation Function:
- Count All is used here to count every order without filtering, which will give the total number of orders over the past 30 days.
- Conditional Count (Alternative): If you want to track a specific segment, such as orders from the USA, you could set up a Conditional Count with
ShipCountryas the filter column and “USA” as the filter value. This configuration would count only orders from the USA, providing a region-specific view. Additionally, if you select Percentage of Total as the display format, this count could be shown as a percentage of all orders, giving insight into the proportion of USA orders compared to the overall total.
- Date Filter Column:
- Select OrderDate as the date filter column to specify the period for the KPI.
- Set the Date Range to “Last 30 Days” to calculate the total orders within the past month.
- Comparison Option:
- Choose Preceding Period to compare the order count from the last 30 days with the previous 30-day period. This allows you to see if sales are trending up or down month-over-month, providing a quick gauge of performance.
- Display Format:
- Numeric Value works well here, as we want to see the exact number of orders in the last 30 days.
- Alternative Display Option: If focusing on a specific segment (e.g., USA orders), setting the display format to Percentage of Total could be insightful to view USA orders as a portion of all orders.
- Enable Drill-Down:
- Drill-Down can be enabled to allow users to click on the Info Box and view a breakdown of the orders data. For example, clicking the KPI could display details like order dates, regions, or customer names. The drill-down report can also be exported or printed for further analysis.
Summary
With these steps, you have a KPI that tracks the 30-day order count in a clear, green Info Box. This KPI dynamically updates, comparing the current 30-day count with the preceding period, offering actionable insights. By adjusting filters, date ranges, and display formats, you can customize this KPI to monitor specific segments or represent the data as a percentage, making it a powerful tool for targeted MySQL data analysis.


