Smart Report Maker is a versatile PHP report writer that offers robust features for creating and editing reports from MySQL databases. In this detailed guide, we walk you through the steps to create a new report or edit an existing one using the report builder wizard.
How to Access the Report Builder
To manage your reports:
- Click “Reports” in the left-side menu.
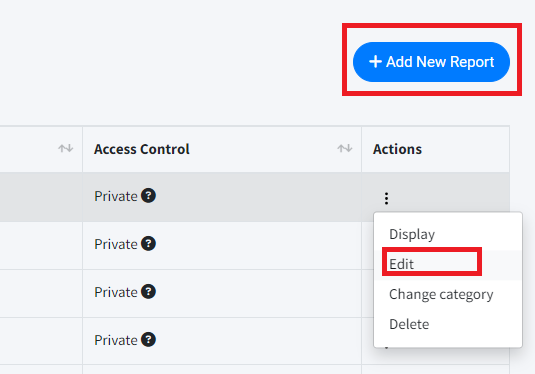
- To Edit a Report: Locate the desired report in the table, click the three dots under “Actions,” and select “Edit”.
- To Create a New Report: Click the “Add New Report” button to launch the report builder wizard.
When editing an existing report, the selected settings will be pre-loaded in the wizard, allowing you to jump directly to the step you need to modify.
Report Builder Wizard: Step-by-Step Guide
Step 1: Select Data Connection
- Choose the appropriate data connection from the list.
- Smart Report Maker supports multiple data connections, giving you flexibility in accessing different databases.
- After selecting the connection, specify the data source type: either “Table” or “SQL Query”.
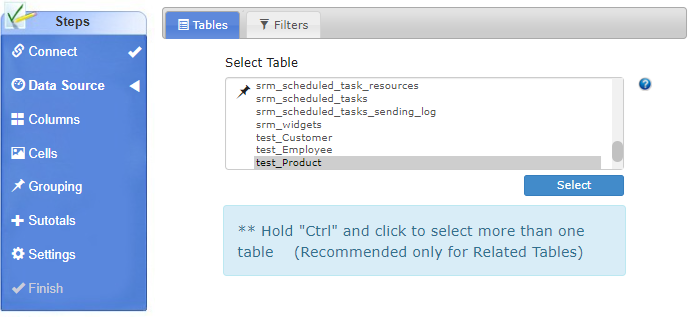
Step 2: Select Data Source
If the Data Source is “Table”:
- Select one or more tables.
- If multiple tables are chosen, define the relationship by:
- Selecting the parent table and its primary key.
- Selecting the child table and its foreign key.
- For example:
- Customers (Primary Key: Customer_ID) → Orders (Foreign Key: Customer_ID).
- If you need to relate more than two tables (e.g., Orders, Order_Details, Products), multiple relationships must be defined.
Data Filters Tab
The filtering options in Smart Report Maker provide users with the ability to fine-tune their reports, ensuring that only relevant data is displayed. Whether generating time-based reports, working with numeric data, or allowing users to input parameters at runtime, these filters offer powerful ways to customize reports and extract meaningful insights from your MySQL database.
Date Filters:
Smart Report Maker provides a variety of date filters, allowing you to create reports tailored to specific time frames or based on dynamic date conditions. These filters enable precise control over the data displayed in your reports.
- Is Today:
- As a use case of this filter, you can create a daily report that only displays records from the current day, such as tracking today’s sales or attendance.
- As a use case of this filter, you can create a daily report that only displays records from the current day, such as tracking today’s sales or attendance.
- Is Current Month:
- A use case for this filter is to generate a monthly report, displaying records such as revenue or customer sign-ups for the current month.
- A use case for this filter is to generate a monthly report, displaying records such as revenue or customer sign-ups for the current month.
- Is Current Quarter:
- This filter allows you to create a quarterly report summarizing the organization’s performance or order volumes for the ongoing three-month period.
- This filter allows you to create a quarterly report summarizing the organization’s performance or order volumes for the ongoing three-month period.
- Is Current Year:
- With this filter, you can generate a yearly report, displaying insights like yearly sales trends or overall growth.
- With this filter, you can generate a yearly report, displaying insights like yearly sales trends or overall growth.
- Other standard date comparisons:
- Equal / Not Equal:
- Show records that match (or don’t match) a specific date.
- Use Case: Display events scheduled on a certain date or exclude holidays.
- Greater Than / Less Than:
- Retrieve records from before or after a specific date.
- Use Case: List orders placed after January 1st or events scheduled before a given date.
- Between:
- Filter records within a specific date range.
- Use Case: Generate a report for orders placed between two dates (e.g., January 1 to January 31).
- Is Null / Is Not Null:
- Identify records with or without a date value.
- Use Case: List records where the delivery date has not yet been assigned (Null) or all completed transactions (Not Null).
- Equal / Not Equal:
Numeric Filters:
Numeric filters are ideal for working with fields containing numeric data, such as prices, quantities, or scores. These filters let you narrow down your results based on ranges or specific values.
- Equals / Not Equals: Finds records where the numeric value matches or differs from a given number.
- Greater Than / Less Than: Filters records above or below a certain threshold.
- Between: Displays records within a specified range.
- Is Null / Is Not Null: Identifies fields with or without numeric values.
Text Filters:
Text filters help you search for specific patterns or words within textual data. These filters are often used with names, descriptions, or product codes.
- Equals / Not Equals: Matches or excludes exact text values.
- Begins With / Ends With: Filters records starting or ending with a particular string.
- Contains: Finds records containing a specific keyword anywhere in the text.
- Is Null / Is Not Null: Identifies records with missing or non-missing text values.
Parameterized Reports: Using the “Ask User” Option
The “Ask User” feature allows you to create parameterized reports that prompt users to provide filter values at runtime. This approach offers flexibility by letting users dynamically select the criteria each time they run the report.
Use Case Example:
- Creating a Date-Range Parameter Report:
- When building a sales report, leave the date filter field empty and enable the “Ask User” option.
- At runtime, users will be prompted to enter a start and end date via a popup, allowing them to generate custom reports based on any desired time range without editing the report design.
This feature is particularly useful when reports need to be reused for different time periods, such as weekly or ad-hoc reports.
Grouping Filters Using AND/OR Conditions
When applying multiple filters, you can control how they are combined:
- AND: All conditions must be met for a record to be included.
- Example: A report showing customers from “USA” AND with orders above $500.
- OR: At least one condition must be met for a record to be included.
- Example: A report displaying either “VIP customers” OR “customers with orders over $1000”.
If the Data Source is “SQL Query”:
- Use the SQL query editor to write and validate your SQL query.
Step 3: Select Columns
Choose the columns to include in the report.
Assign labels to columns to make them more readable. You can also use this step to translate labels into other languages (Smart Report Maker supports 5 interface languages).
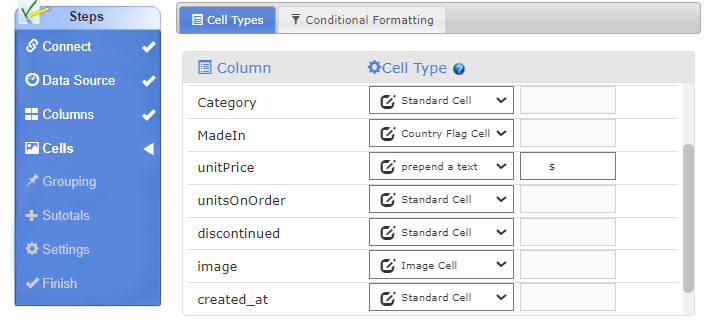
Step 4: Customize Cell Appearance
Customizing the appearance of report columns in Smart Report Maker helps present data more clearly and meaningfully. From displaying images to highlighting critical values through conditional formatting, these features enhance the visual appeal and usability of reports. With support for multiple formatting rules, Smart Report Maker allows for precise and dynamic data visualization tailored to your reporting needs.
Customize how data appears in your report columns:
- Standard Cell:
- Displays data exactly as stored in the MySQL database.
- Displays data exactly as stored in the MySQL database.
- Image Cell:
- Displays images stored as filenames in the database. How to Display Images in Reports:
If your report needs to show images (instead of just filenames), follow these steps:- Upload the actual images to a subdirectory named “images” located at:
srm/modules/SRM9/SRM/Reports9/{{your-report-name}}/images/.
- In the report builder, set the relevant column’s cell type to “Image”. This ensures that when the report is generated, the filenames in the database are replaced with the actual images stored in the “images” folder.
- Upload the actual images to a subdirectory named “images” located at:
- Displays images stored as filenames in the database. How to Display Images in Reports:
- Star Rating:
- Converts numeric values (e.g., ratings) into graphical stars.
- Converts numeric values (e.g., ratings) into graphical stars.
- Link Cell:
- Displays data as clickable links to the stored URLs.
- Displays data as clickable links to the stored URLs.
- True/False Cell:
- Uses checkboxes to visually represent Boolean (true/false) values.
- Uses checkboxes to visually represent Boolean (true/false) values.
- Country Flag:
- Displays the country’s flag based on stored country names or codes.
- Displays the country’s flag based on stored country names or codes.
- Monetary Value:
- Formats numeric data to represent currency values with commas and symbols.
- Formats numeric data to represent currency values with commas and symbols.
- Append/Prepend Text:
- Adds text to the beginning or end of a cell value (e.g., appending “USD” for currency or units of measurement).
- Adds text to the beginning or end of a cell value (e.g., appending “USD” for currency or units of measurement).
Conditional Formatting: Enhance Data Interpretation
Smart Report Maker allows you to apply conditional formatting to highlight data based on specific values. This feature improves readability and helps users identify important patterns or anomalies.
- How to Apply Conditional Formatting:
- In the “Conditional Formatting” tab, select the field you want to apply the rule to.
- Choose the condition (e.g., greater than, less than, equals).
- Define the filter value (e.g., “< 10” for units in stock).
- Set the color or formatting style to apply when the condition is met.
- Click “Add” to save the rule.
- Use Case Example:
Apply conditional formatting to a “Units in Stock” column. If the value drops below 10, the report highlights the field in red, alerting users to low stock levels. - Multiple Conditional Rules:
You can apply multiple rules within the same report. For example:- Highlight high-priority orders in yellow.
- Mark overdue payments in red.
- Indicate completed tasks in green.
This flexibility enables users to quickly scan reports and focus on key data points.
Step 5: Grouping and Sorting in Smart Report Maker
Grouping and sorting play a key role in organizing data within your report for better readability and analysis. Here’s a detailed guide on how to group and sort your report data effectively:
Grouping:
Grouping is required if you want to use the subtotals feature in Step 6. If you don’t define a group, the subtotals feature will be disabled.
Purpose of Grouping: Grouping allows you to organize data based on shared values in a column. This is essential for reports where you want to categorize information (e.g., group sales by region or orders by customer).
How to Apply Grouping:
Select the Group By column(s) from the available options.
You can apply multiple groupings if needed (e.g., group by “Customer” first and then by “Order Date”).
Sorting:
- Purpose of Sorting: Sorting allows you to display data in a logical order, making it easier to read and understand.
- How to Apply Sorting:
- Select the Sort By column(s).
- Choose the order: ascending or descending.
- You can apply sorting to multiple columns, such as sorting by “Order Date” within each customer group.
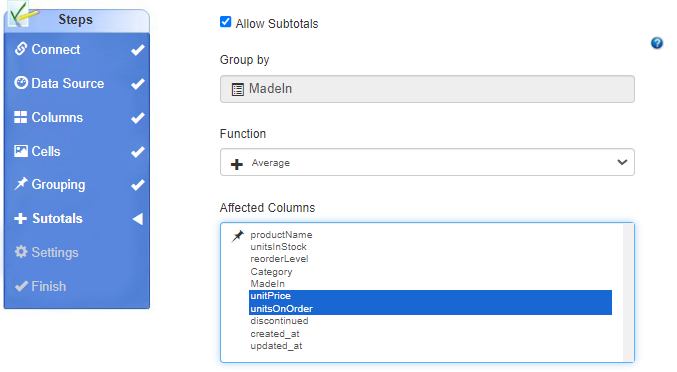
Step 6: Subtotals in Smart Report Maker
Subtotals and grand totals offer insights by aggregating data at different levels within the grouped categories. Here’s how you can enable and configure subtotals:
- Enable Subtotals and Grand Totals:
- Ensure that you’ve selected at least one grouping column in Step 5. Subtotals are only available when the data is grouped.
- Choose Aggregation Functions:
- Smart Report Maker supports several aggregation functions:
- SUM: Adds up all numeric values in the selected column(s).
- AVG: Calculates the average of the values.
- MAX / MIN: Finds the highest or lowest value.
- COUNT: Counts the number of entries.
- Smart Report Maker supports several aggregation functions:
- Select Columns for Aggregation:
- Choose the columns where you want the aggregation to be applied. For example:
- SUM can be applied to the “Order Total” column to show the total value of orders for each customer.
- COUNT can be used on the “Order ID” column to display the number of orders per customer.
- Choose the columns where you want the aggregation to be applied. For example:
- Grand Totals:
- In addition to subtotals for each group, you can enable grand totals at the bottom of the report to show the overall total for the entire dataset.
Use Case Example:
Generate a sales report grouped by region. Apply the SUM function to the “Order Value” column to display the total sales per region and enable grand totals to see the overall sales figure at the end of the report.
Step 7: Report Settings
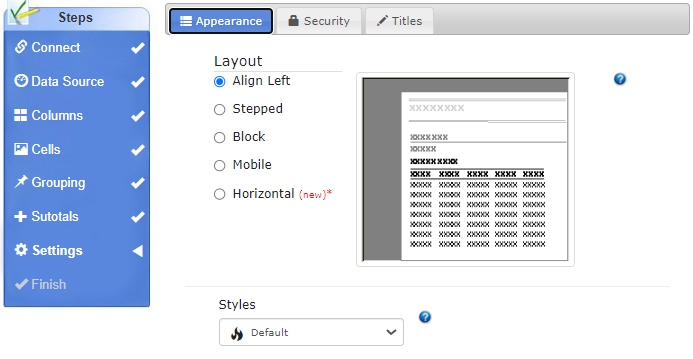
- Select Layout and Style: Choose the visual theme and layout of your report.
- Define Security Settings:
- For Admins and Specific Groups: Restrict report access to selected groups.
- Admin-Only: Make the report available only to users with the Admin role.
- Public: The public report option in Smart Report Maker allows users to share reports openly with anyone, regardless of whether they are logged into the system. Public reports are accessible via a public URL, meaning that the data they contain can be freely viewed by anyone with the link.
- Titles and Categories:
- Set the report’s title, header, footer, and category.
- Choose the language and define the number of records displayed per page.
Saving and Accessing Reports
- Once saved, reports are physically stored on the server at:
Path-to-srm/srm/modules/SRM9/SRM/Reports9/{{report-name}}. - Reports are auto-updated as new data is added to the database, ensuring you always have the latest information.
Conclusion
Smart Report Maker provides a comprehensive and flexible PHP report writer designed to create, edit, and manage MySQL reports. With features like dynamic data connections, powerful filtering, parameterized reports, grouping, and subtotaling, users can build highly customized reports tailored to their needs. The ability to display images, apply conditional formatting, and share reports publicly or privately makes Smart Report Maker a versatile tool for professional reporting. Whether sharing insights through public reports or controlling access with role-based permissions, Smart Report Maker ensures that your data is presented clearly and effectively.

