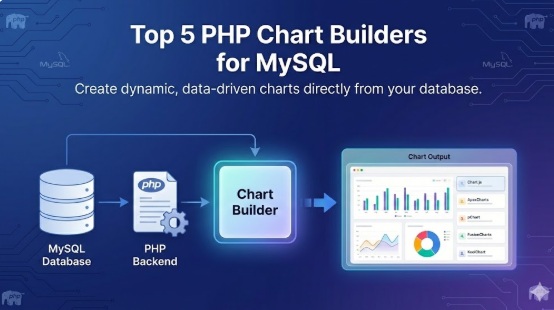
Top 5 PHP Chart Builders for MySQL
Visualizing MYSQL database data is a core requirement for modern MYSQL web applications. Whether you are building a SaaS product, an internal business system, or a customer-facing analytics portal, turning raw data into meaningful MYQL charts and MYSQL graphs dramatically improves usability and decision-making.
When working with MySQL visualization in PHP, solutions usually fall into two categories:
- End‑product tools that provide ready‑made dashboards, chart builders, and embedded analytics features.
- Charting libraries that developers integrate into their own PHP code to render MySQL charts and graphs programmatically.
Both approaches can convert MySQL data into interactive MYSQL charts, MySQL graphs, and visual reports—but they differ greatly in ease of use, flexibility, and time to market.
Below are some of the best PHP MYSQL chart builders , covering both tools and libraries.
1. Smart Report Maker (Tool)
Smart Report Maker is a PHP‑based reporting and dashboard solution built specifically for MySQL and MariaDB. It provides a wizard‑driven interface that allows developers and non‑technical users to transform SQL queries into charts, dashboards, pivot tables, and drill‑down reports.
It includes a built‑in Embed Manager for secure embedded analytics, making it easy to place MySQL charts and dashboards inside any PHP application with minimal code. Smart Report Maker supports interactive filters, drill‑down navigation, scheduled reports, and export options, making it suitable for full MySQL visualization use cases.
Best for: Teams that want a ready‑to‑use PHP tool for MySQL charts, dashboards, pivot tables, and embedded analytics.
2. Google Charts (Library)
Google Charts is a free, web‑based visualization library that offers a wide variety of interactive chart types. It connects easily to MySQL through PHP by outputting query results into JavaScript arrays or JSON.
It supports real‑time updates, interactivity, and drill‑down navigation. Google Charts is also compatible with Google Sheets, making it useful for hybrid data workflows that mix MySQL visualization with spreadsheet‑based reporting.
Best for: Applications that want free, feature‑rich interactive charts with minimal setup.
3. Dashboard Builder (Tool)
Dashboard Builder is designed to generate complete web‑based dashboards from MySQL without heavy coding. It produces PHP source code that you can directly integrate into your application, giving you full control over layout, styling, and behavior.
It supports responsive charts, real‑time data refresh, and interactive visualizations. Because it outputs standard PHP and JavaScript, developers can extend it with drill‑down links, filters, and custom UI components, making it a flexible solution for embedded MySQL charts.
Best for: Developers who want visual dashboard generation with full access to the generated PHP code.
4. pChart (Library)
pChart is an open‑source PHP charting library focused on rendering high‑quality, anti‑aliased charts directly on the server. It is well suited for generating static or image‑based MySQL graphs such as line charts, bar charts, and pie charts.
Because pChart runs entirely in PHP, it can be embedded into any PHP application without external JavaScript dependencies. However, it has a steeper learning curve and can be resource‑intensive for large datasets or real‑time MySQL visualization.
Best for: Projects that require server‑side image charts and fine‑grained visual customization in PHP.
5. Chart.js (Library)
Chart.js is a popular JavaScript charting library that integrates smoothly with PHP backends. PHP is used to query MySQL, format the data as JSON, and pass it to Chart.js for rendering responsive, modern charts in the browser.
It supports line charts, bar charts, pie charts, and area charts with animation and interactivity. Developers can implement drill‑down behavior, tooltips, and filters by combining Chart.js with PHP and JavaScript logic, making it a strong choice for embedded MySQL charts.
Best for: PHP applications that need modern, responsive client‑side MySQL charts.
Key Factors to Consider When Choosing a PHP Chart Builder
Choosing the right tool or library for MySQL charts and embedded analytics depends on your product goals and technical constraints.
1. Embedded Analytics Requirements
If your application needs fully embedded dashboards and analytics modules, tools like Smart Report Maker or Dashboard Builder are better suited than low‑level libraries.
2. Technical Expertise
Charting libraries such as Chart.js and pChart require solid PHP and JavaScript skills. End‑product tools are easier for teams with limited front‑end or visualization experience.
3. Licensing and Cost
Some solutions are open source and free, while others are commercial. Always verify that the license fits your business and distribution model.
4. Interactivity and Drill‑Down
If you need drill‑down reports, filters, or real‑time MySQL visualization, ensure the solution supports interactive behavior.
5. Customization and Branding
White‑labeling, UI theming, and layout control are important if charts must match your product’s design.
Final Thoughts
From lightweight PHP charts and MySQL graphs to full embedded analytics platforms, there are many ways to visualize MySQL data in PHP.
Libraries like Chart.js, Google Charts, and pChart give developers full control, while tools like Smart Report Maker and Dashboard Builder provide faster time‑to‑market with built‑in MySQL visualization features.
The best choice depends on how much interactivity you need, how quickly you want to deploy, and how deeply analytics must be embedded into your application.